
Stress testing with JMeter
Apache JMeter is an open source Java desktop application, built to verify functional behavior, perform load tests, and measure performance. Some of JMeter points of strength are mentioned here below:
- It ships with an easy-to-use GUI;
- It allows to set up multiple thread groups, different parallelism and request count, to ramp up the load;
- It can use CSV files to generate semi-randomized requests;
- It can execute parameterized tests;
- It reports results in a simple table;
- It uses assertions for checking test results;
- It can be executed in batch.
In the picture below we have summarised the basic concepts of a JMeter test which we are going to build right afterwards.
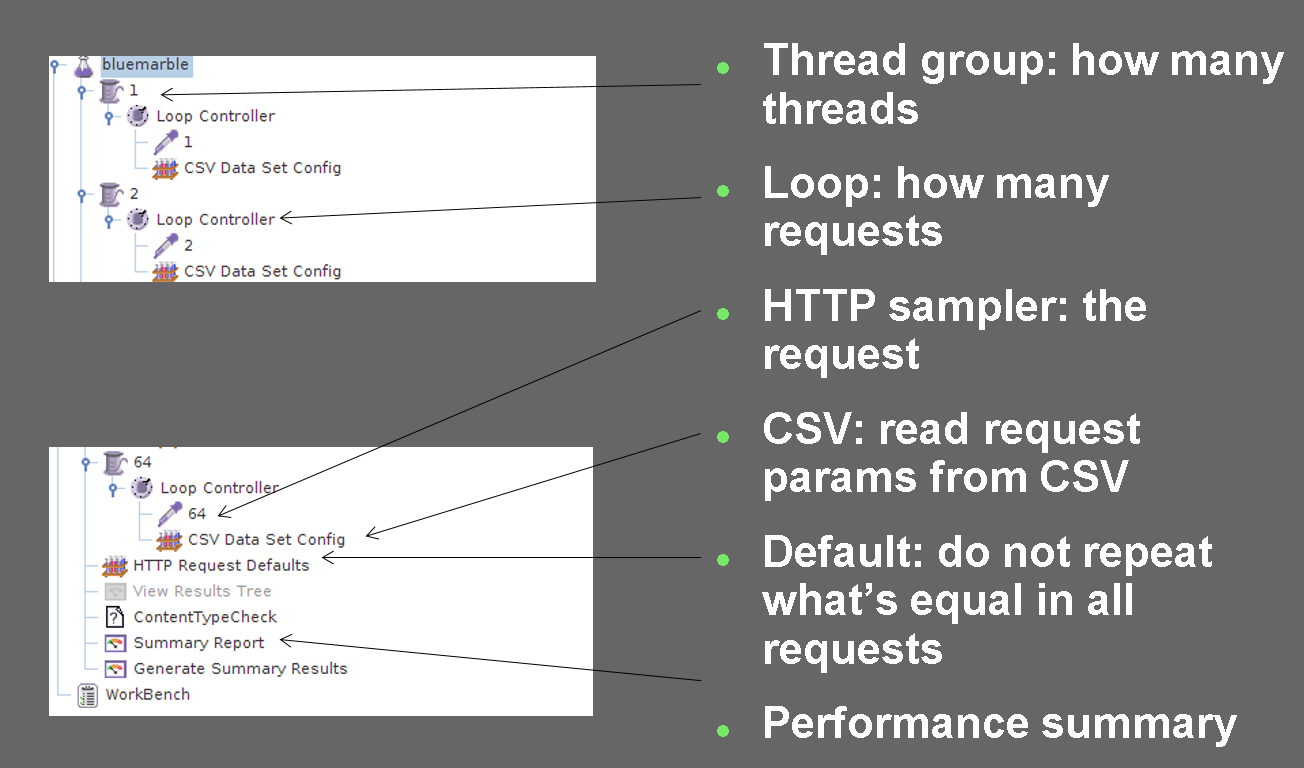
JMeter basic concepts
Configuring a simple test
This section explains how to run performance tests using JMeter in order to evaluate the GeoServer performances when serving WMS requests. The performance test aims to stress the server and evaluates the response time and throughput with an increasing number of simulated users sending concurrent requests to the server.
Note
Ideally, to avoid adding extra load to the server JMeter should run on a different machine.
Warning
If you have performed the exercises in the security section, please go back to the layer and service security pages and open access to everybody, on all data and all services, before performing the exercises in this section
From the training root, on the command line, run
jmeter.bat(orjmeter.shif you’re on Linux) to start JMeter: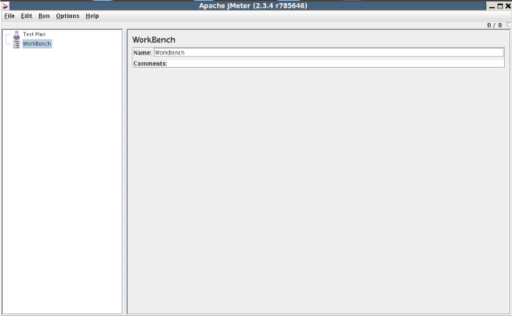
jMeter interface
Add a new Thread Group with the mouse right click on
Test Plantree node: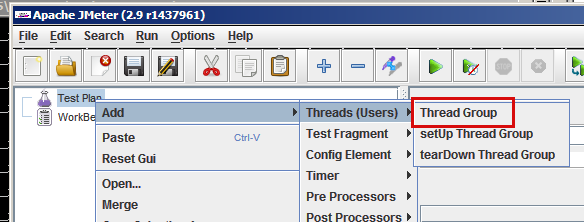
Adding a new Thread Group
In the
Thread Grouppanel set the number of thread for the test to 4 (this represents the number of simultaneous requests that are made to GeoServer) and the ramp-up period to 60. Also, chekForeveron the Loop Count field.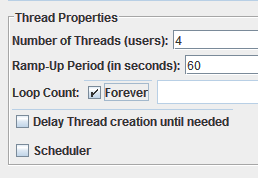
Setting the Thread Group
Add a new Loop Controller with the mouse right click on
Thread Grouptree node: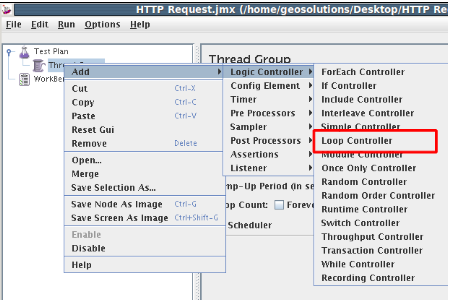
Adding a new Loop Controller
Right click on the
Loop Controllertree node and add a new HTTP Request element: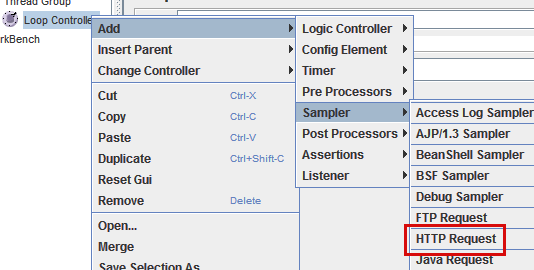
Adding a new HTTP Request
In the HTTP Request enter the following basic configuration:
Field Value Server Name or IP localhost Port Number 8083 Path geoserver/ows 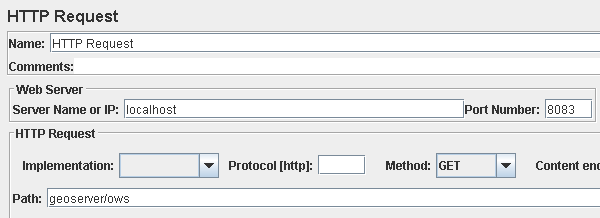
HTTP Request host/port/path configuration
From the training data dir root, open the
data/jmeter_data/jmeter_request_params.txt, select and copy its contents in the clipboard, then click “Add from Clipboard” in the “HTTP request” panel to setup a sample GetMap request:
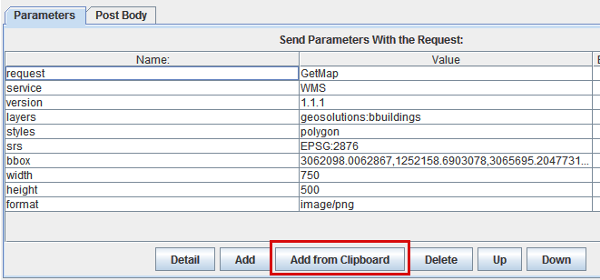
HTTP parameters configuration
Add the following listeners by right clicking on
Test Plantree node:View results Tree,Summary Report,Graph results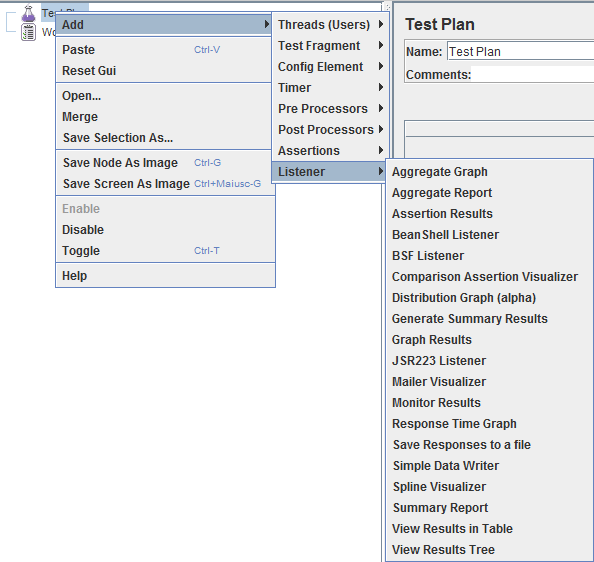
Adding a Listeners
Save this configuration into
data/jmeter_data/asjmeter_simple.jmx
At this point JMeter is configured to run a GeoServer performance test:
Click on
Runtool and select Start to startig the jMeter test.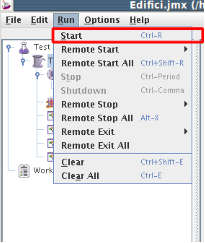
starting jMeter test
Select
View Results Treeto directly see the request informations produced and the request result: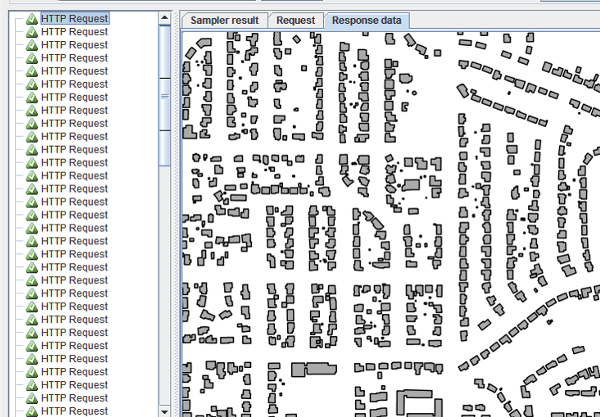
The View Results Tree panel
Select
Summary reportto view the statistical informations about the requests: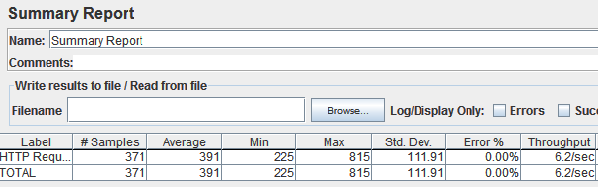
The Aggregate Graph panel
Select
Graph Resultsto analyze the technical trend of the requests: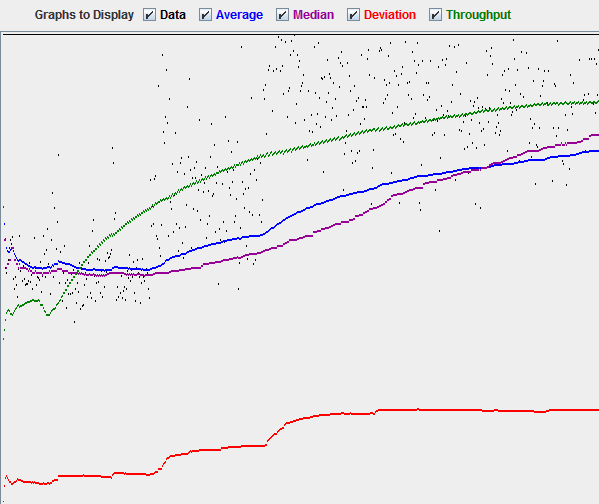
The Spline Visualizer panel
Click on
Runtool and select Stop to end the benchmarking session
Creating a Multiscale test
This chapter explains how to create a custom randomized Multiscale test with a set of multiple concurrent threads.
In the example before, we ran a test on a layer always requesting the same bounding box and image size. Now we should set up a more sophisticated test asking for different bounding boxes and resolutions, i.e. a multiscale test. Multiscale testing is useful because it stresses GeoServer requesting new data each time, mimicking real usage conditions and providing better testing for eventual SLD scale dependencies. With JMeter we can execute the test by passing a CSV file containing multiple randomized bounding boxes and image dimensions.
In the first paragraph we are going to describe how to generate a CSV file for randomized requests at different scales. In the second one is shown how to configure a new JMeter test with multiple simultaneous threads.
Create CSV file
Only for Windows machines: open the file
OSGeo4W.batunder%TRAINING_ROOT%folder inside the training home folder.Run:
Linux:
cd $TRAINING_ROOT/geoserver_data/data/boulder

gdalinfo srtm_boulder.tiff
Windows:
cd %TRAINING_ROOT%\geoserver_data\data\boulder

gdalinfo srtm_boulder.tiff
The output of the command will be something like this:
Driver: GTiff/GeoTIFF
Files: srtm_boulder.tiff
Size is 2520, 1800
Coordinate System is:
GEOGCS["WGS 84",
        DATUM["WGS_1984",
                SPHEROID["WGS 84",6378137,298.257223563,
                        AUTHORITY["EPSG","7030"]],
                AUTHORITY["EPSG","6326"]],
        PRIMEM["Greenwich",0],
        UNIT["degree",0.0174532925199433],
        AUTHORITY["EPSG","4326"]]
Origin = (-105.700138888888890,40.300138888888888)
Pixel Size = (0.000277777777778,-0.000277777777778)
Metadata:
  AREA_OR_POINT=Area
Image Structure Metadata:
  INTERLEAVE=BAND
Corner Coordinates:
Upper Left  (-105.7001389,  40.3001389) (105d42' 0.50"W, 40d18' 0.50"N)
Lower Left  (-105.7001389,  39.8001389) (105d42' 0.50"W, 39d48' 0.50"N)
Upper Right (-105.0001389,  40.3001389) (105d 0' 0.50"W, 40d18' 0.50"N)
Lower Right (-105.0001389,  39.8001389) (105d 0' 0.50"W, 39d48' 0.50"N)
Center      (-105.3501389,  40.0501389) (105d21' 0.50"W, 40d 3' 0.50"N)
Band 1 Block=256x256 Type=Int16, ColorInterp=Gray
  Overviews: 1260x900, 630x450, 315x225, 158x113, 79x57, 40x29
The information needed to create a multiscale CSV file are:
Tile Size 256 x 256 Pixel Size 0.000277777777778 Bounding Box ((-105.7001389, -105.0001389), (39.8001389, 40.3001389)) Run:
- Linux::
cd $TRAINING_ROOT/data/jmeter_data

python ./wms_request.py -count 100 -region -105.7 39.8 -105.0 40.3 -minres 0.00028 -maxres 0.00224 -minsize 256 256 -maxsize 1024 1024 > multiscale.csv
- Windows::
cd %TRAINING_ROOT%\data\jmeter_data

wms_request.py -count 100 -region -105.7 39.8 -105.0 40.3 -minres 0.00028 -maxres 0.00224 -minsize 256 256 -maxsize 1024 1024 > multiscale.csv
wms_request.py is a python script which generates randomized requests at different bounding box and resolutions. The parameters are described in the following table:
Parameter Description count Indicates the number of requests to generate region Indicates the maximum bounding box of each request minres/maxres Indicates the minimum and maximum value for the Pixel Size to request (Typically it should be at least the minimum resolution) minsize/maxsize Indicates the minimum and maximum dimensions of the requested image (Typically it should be at least as big as the tile size) The CSV file is structured following the rule
$width;$height;$bbox.For example
290;444;-105.5904,39.910198,-105.48776,40.067338indicates a request of size 290x444 and Bounding box [-105.5904,39.910198,-105.48776,40.067338].JMeter must be configured for parsing the CSV file correctly by using the
CSV Data Set Configelement.
Configure JMeter
From the training root, on the command line, run
jmeter.bat(orjmeter.shif you’re on Linux) to start JMeter:
jMeter interface
Add three new items of type Thread Group called 1, 2, 4
For each Thread Group set the
Number of Thread (users)field equal to the Thread Group name, theRamp-Up PeriodandLoop Countfields to 1.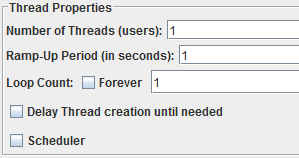
Setting the Thread Group (here: Thread Group 1)
In the Test Plan section, check the Run Thread Groups consecutively checkbox
Add a new Loop Controller to the first Thread Group object
Right click on the
Loop Controllertree node and add a new HTTP Request element with the same name of the Thread Group: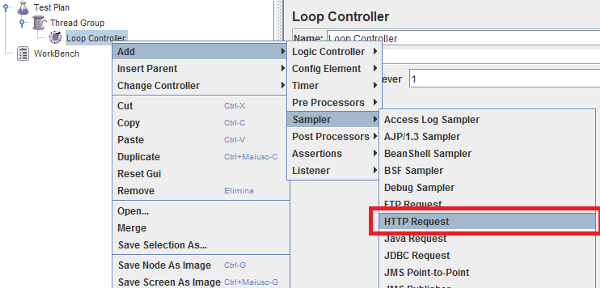
Setting the HTTP Request
In each HTTP Request add the following fields to the panel:
Name Value Encode? Include Equals? bbox ${bbox} unchecked checked height ${height} unchecked checked width ${width} unchecked checked Which should look like in the picture
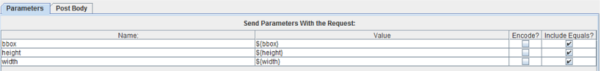
HTTP Request panel configuration
Uncheck the
Follow RedirectsandUse KeepAlivecheckboxRight click on the
Loop Controllertree node and add a new CSV Data Set Config element: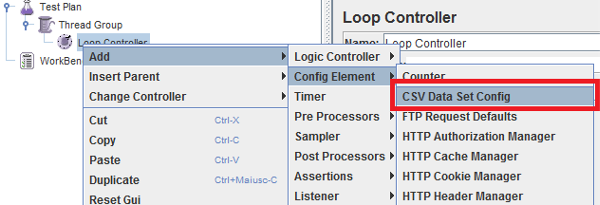
Setting the CSV Data Set Config
Configure the
CSV Data Set Configas follows:Field name Value Filename ./multiscale.csv Variable names width,height,bbox Delimiter ; 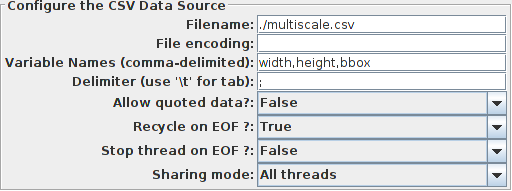
Configuring the CSV Data Set Config
Right click the loop controller and choose “Copy”, then right click the other thread groups (one by one) and choose “paste” to get a full copy of the controller, HTTP sampler and CSV confiuration. Adjust each “HTTP request” node name to match the thread group name (1, 2 and 4)
Configure the Loop Controller along the following schema:
- Thread Group
- 1
- Loop Controller –> Loop Count
- 100
- Thread Group
- 2
- Loop Controller –> Loop Count
- 50
- Thread Group
- 4
- Loop Controller –> Loop Count
- 50
From the
Test Plantree node add an HTTP Request Defaults element (Config Element -> HTTP Request Defaults) and enter the following basic configuration:Field Value Server Name or IP localhost Port Number 8083 Path geoserver/ows It should look like this:
HTTP Default Request host/port/path configuration
From the training data dir root, open the
data/jmeter_data/jmeter_request_params_2.txt, select and copy its contents in the clipboard, then click Add from Clipboard in the HTTP request panel to set up a sample GetMap request:Add the following listeners by right clicking on
Test Plantree node: View results Tree and Summary ReportAdd the following assertions by right clicking on
Test Plantree node: Response Assertion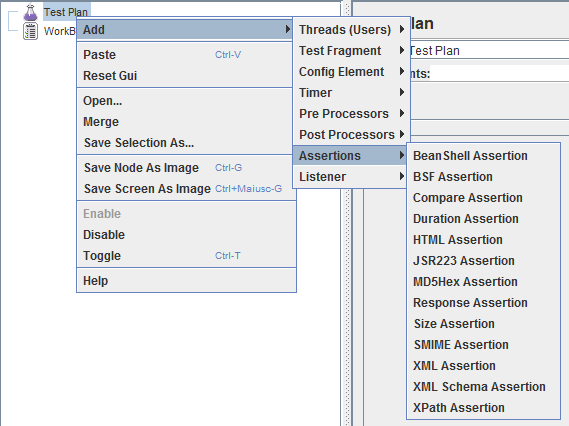
Adding Assertions
Note
Using
Assertionsis helpful because it avoids to continuously do a visual check on the results.Configure the Response Assertion following this table:
Field Value Apply to Main sample only Response field to test Response Headers Pattern Matching Rules Contains In the
Pattern to testpanel add:Content-Type: image/png
The final result should look like in the picture:
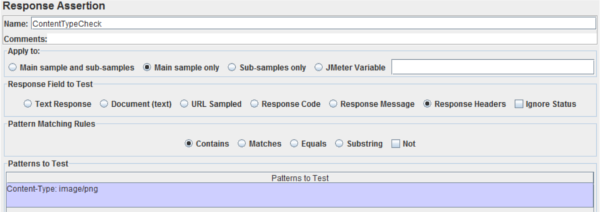
Configuring Response Assertion
The overall test plan should look as follows. Save it in the
jmeter_datadirectory asmultiscale.jmx
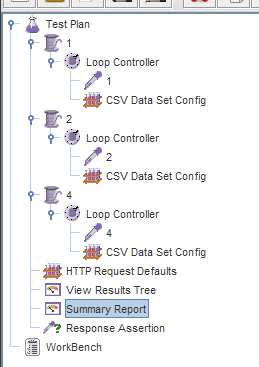
Saving the multiscale benchmark
At this point JMeter is configured to run a GeoServer performance test:
Select the Test Plan tree node and select
Run-Startfrom the top menu to start the JMeter test.
starting JMeter test
Select
View Results Treeto directly see the request information produced and the requests results: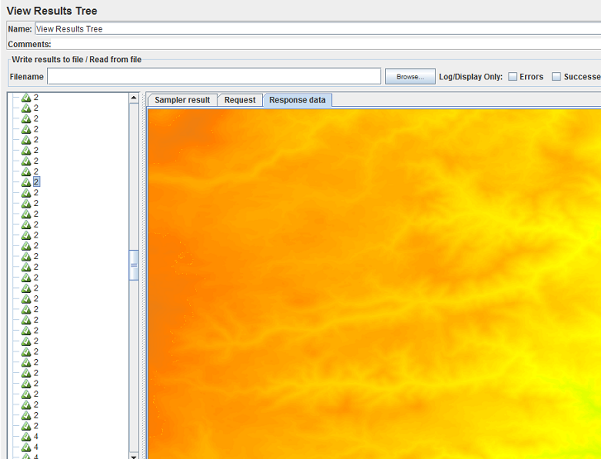
The View Results Tree panel with a sample request
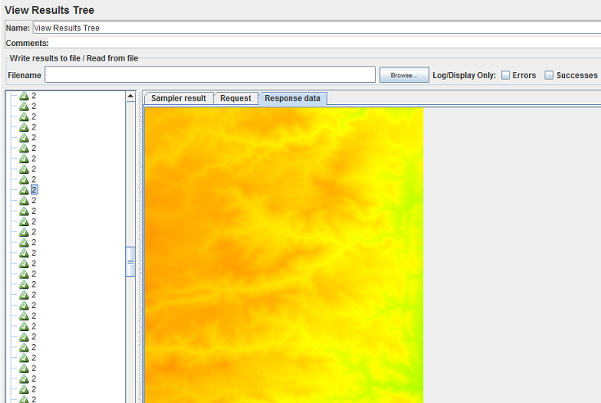
Another request with different resolution and bounding box
Select
Summary Reportto view the statistical information about the requests: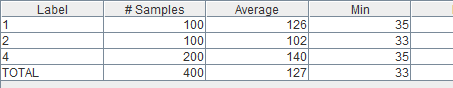
Suymmary report panel