Styling the layers at 1:50M
The Natural Earth dataset provides a set of layers at 1:50M. Most of them continue on the same track of the layers at 1:100M, offering more details: for these layers, the style will have to seamlessly continue to same symbology provided at lower scales, with attention to the new details.
Extending the political map group
Let’s add the necessary layers to the ne_political layer group.
Add layers in this order, making sure the “use default style” checkbox is selected:
ne_10m_ocean_scale_rank (not a typo, it’s really 10m)
ne_50m_admin_0_countries
ne_50m_admin_0_breakaway_disputed_areas
ne_50m_admin_1_states_provinces_lakes
ne_50m_urban_areas
ne_50m_populated_places
The layer group should appear as follows:
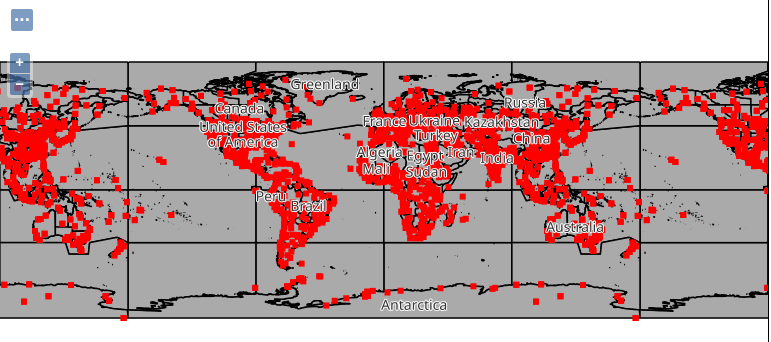
The map will show the 50M layers on top of everything, because, for the moment, they lack style scale dependencies:
Styling the ocean layer
The ne_10m_ocean_scale_rank layer contains the oceans, suitable for display at 1:10M,
split in smaller polygons for better performance. While a 1:50M layer is also available,
it was found that the 1:10M one also displays quickly at lower scales.
The style should follow the 1:110M one, so it’s possible to just copy it, and adapt the scale dependencies:
Let’s create a basic CSS style for oceans:
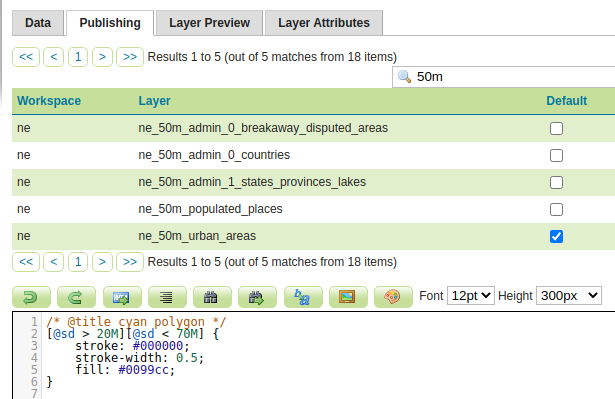
Create a new style
Name it
ne_10m_ocean_scale_rankSet the workspace to
neSet the format to
CSSUse the
Copy from existing stylefunctionality, and choose the “ne_110m_ocean” style. Click on CopyClick Apply
Switch to the Publishing tab, and associate the style to the corresponding layer.
Change the scale dependency so that the layer will show when the scale denominator is lower than 1:70M
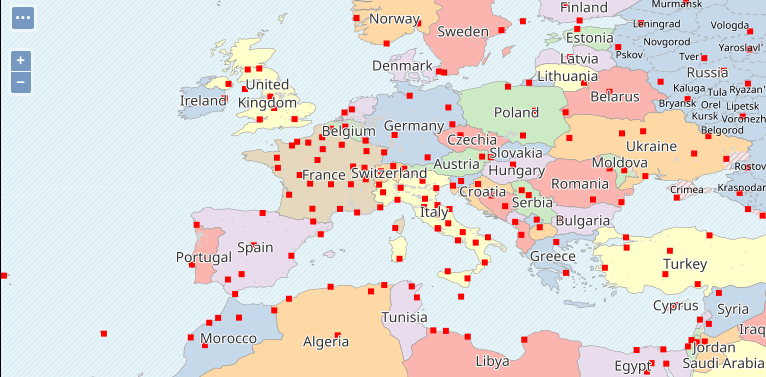
Go to the layer group preview and zoom in to 1:70M, the following map should appear:
Styling the countries
The ne_50m_admin_0_countries layer contains countries at a higher definition, compared
to its 1:100M sibling. Besides that, the information provided is the same.
Just like with oceans, set up a new style by copying the 1:100M one, and update the scale dependencies:
Create a new style
Name it
ne_50m_admin_0_countriesSet the workspace to
neSet the format to
CSSUse the
Copy from existing stylefunctionality, and choose the “ne_110m_countries” style. Click on CopyClick Apply
Switch to the Publishing tab, and associate the style to the corresponding layer.
Change the scale dependency so that the layer will show when the scale denominator is between 20M and 70M.
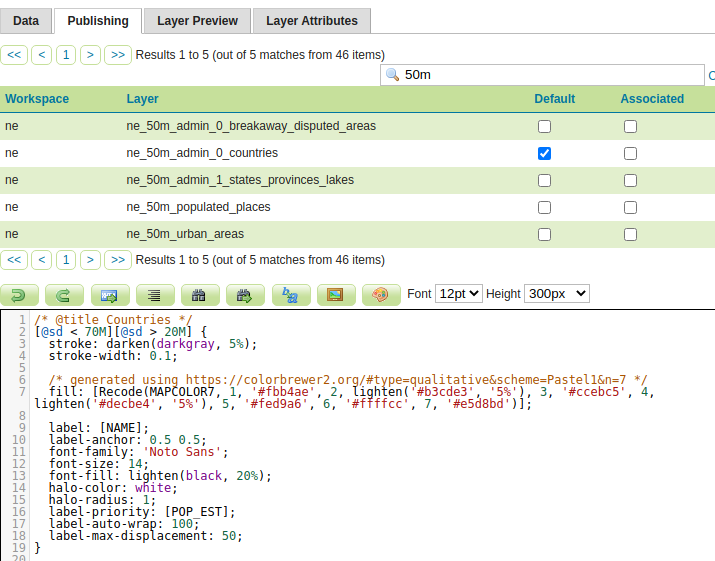
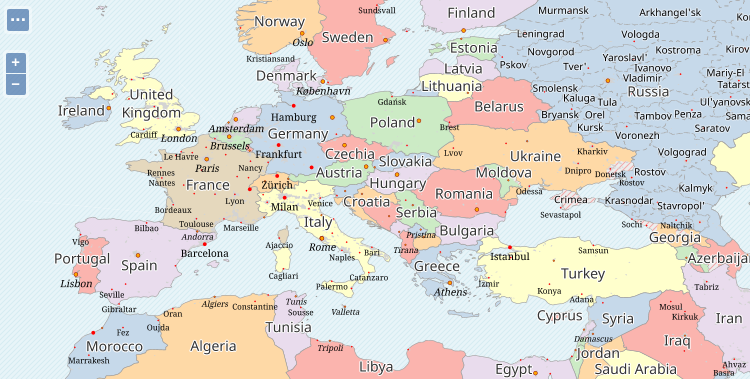
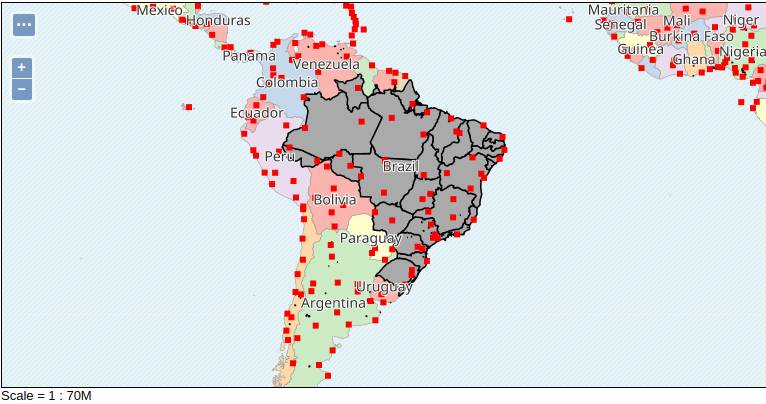
Go to the layer group preview and zoom in to 1:70M, the following map should appear (the states/provinces layer covers some countries, pan around to see some styled countries):
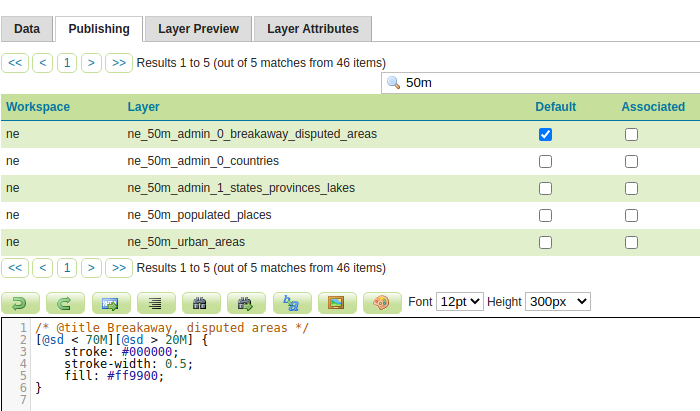
Styling the breakaway, disputed areas
The ne_50m_admin_0_breakaway_disputed_areas contains a set of areas whose ownership
is disputed, occupied territories and other politically problematic places.
Given the sensitiveness of the topic, the style will try to hide the underlying land ownership, as reported in the countries layer, which is based on the de facto policy.
Let’s first create a basic style for it:
Create a new style.
Name it
ne_50m_admin_0_breakaway_disputed_areas.Set the workspace to
ne.Set the format to
CSS.Use the
Generatefunctionality to create a basicpolygonstyle.Click Apply.
Switch to the Publishing tab, and associate the style to the corresponding layer.
Update the title to state “Breakaway, disputed areas”.
Change the scale dependency so that the layer will show when the scale denominator is above 20M.
Styling wise:
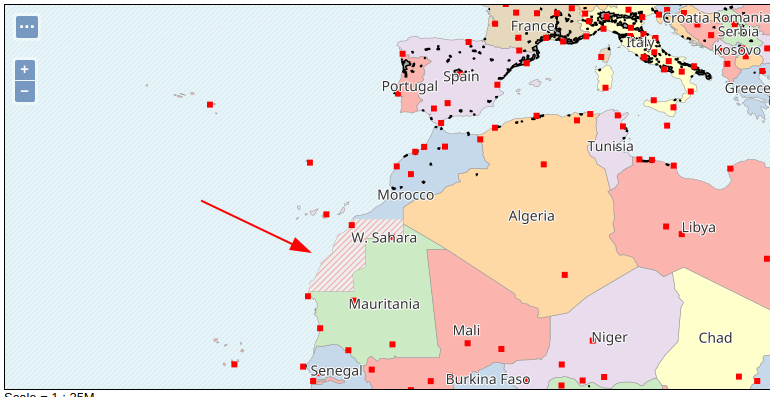
To hide the original area ownership, and provide a sense of “neutrality”, use a light gray color (lightened 10% for best contrast with the other fills).
To provide a sense of problematic territory, overlay a red dash fill.
The overall style should look as follows:
/* @title Breakaway, disputed areas */
[@sd > 20M] {
    fill: lighten(lightgray, 10%), symbol('shape://slash');
    :fill {
        size: 6;
        stroke: red;
        stroke-opacity: 30%;
    }
}
Switch to the layer group preview, a visible disputed area can be found in Africa, over the south of Morocco.
Styling states and provinces at 1:50M
The ne_50m_admin_1_states_provinces_lakes follows up the corresponding layer
at 1:110M.
First, set up the style as a copy of the 110M one:
Create a new style.
Name it
ne_50m_admin_1_states_provinces_lakes.Set the workspace to
ne.Set the format to
CSS.Use the
Copy from existing stylefunctionality, and choose the “ne_110m_states” style. Click on Copy.Click Apply.
Switch to the Publishing tab, and associate the style to the corresponding layer.
Change the scale dependency so that the layer will show when the scale denominator is between 20M and 70M.
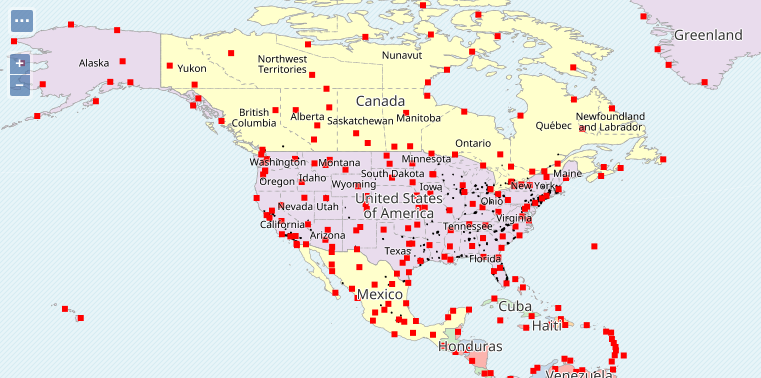
The layer group should now show the following:
Within this scale ranges, some states are big enough to host a label. The label should be small enough not to be confused with the country names, and to avoid crowding the map with too many labels, the style will show the label only if it’s mostly inside the polygon it belongs to:
Add a label on the
nameattribute, centered in the polygon using the 50% anchor.The font is
Noto Sans, 10 pixes, black.A white halo, 1px, 50% opaque increases readability of the label.
Set auto-wrapping to 70 pixels, max displacement to 50.
In order to cut down on the number of labels, set the “goodness of fit” to 80%.
The final style should look as follows:
/* @title States */
[@sd > 20M] [@sd < 70M] {
    stroke: darkgray;
    stroke-dasharray: 4 4;
    stroke-width: 0.1;

    label: [name];
    label-anchor: 0.5 0.5;
    font-family: 'Noto Sans';
    font-size: 10;
    font-fill: black;
    halo-color: white;
    halo-radius: 1;
    halo-opacity: 50%;
    label-auto-wrap: 70;
    label-max-displacement: 50;
    label-fit-goodness: 0.8;
    label-priority: 50M;
}
In the above style, the label priority has been set to 50M. This arbitrary value
will make sure the state labels have higher priority than the cities, but typically not
of their state (the layer, unfortunately, does not provide an estimate of the population by state/province).
The layer group map should now show:
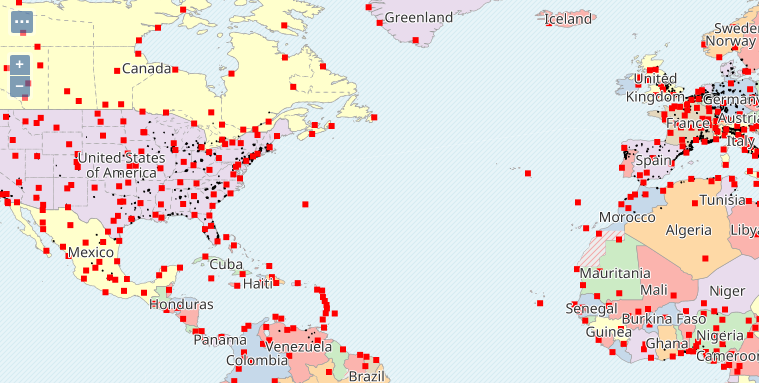
Styling the urban areas
This new layer shows urban areas over the land. The layer is a simple polygonal presence, does not have names or other attribute of significance.
Let’s first create a basic style for it:
Create a new style.
Name it
ne_50m_urban_areas.Set the workspace to
ne.Set the format to
CSS.Use the
Generatefunctionality to create a basicpolygonstyle.Click Apply.
Switch to the Publishing tab, and associate the style to the corresponding layer.
Update the title to state “Urban areas”.
Change the scale dependency so that the layer will show when the scale denominator is between 20M and 70M.
For this them, a simple gray will be used:
/* @title Urban areas */
[@sd < 70M][@sd > 20M] {
    fill: lightgray;
}
The layer group map should now show the following (the arrow is pointing to some urban areas in northern Italy):
Styling the populated places
The ne_50m_populated_places layer follows up with the corresponding layer at 1:100m, but
adds a significant number of cities. There is thus an opportunity to show some hierarchy in the
symbolization, based both on the political importance of the city, as well as its size.
First of all, let’s create a new style by copying the previous one:
Create a new style.
Name it
ne_50m_populated_places.Set the workspace to
ne.Set the format to
CSS.Use the
Copy from existing stylefunctionality, and choose the “ne_110m_populated_places” style. Click on Copy.Click Apply.
Switch to the Publishing tab, and associate the style to the corresponding layer.
Change the scale dependency so that the layer will show when the scale denominator is between 20M and 70M.
It’s possible to add some hierarchy in the output by considering two attributes:
WORLDCITY, valued at 0 or 1, indicates if a city is of worldwide importance. Cities of world importance should be bigger.FEAATURECLAindicates the type of city, capitals are identified byAdmin-0 capital. Capitals should stand out both due to their symbology, and their font.
With this in mind, let’s leverage CSS cascading to indicate the properties we want, the cascading engine will generate the single combinations (world city and capital, world city but not capital, and so on).
The final style should look as follows:
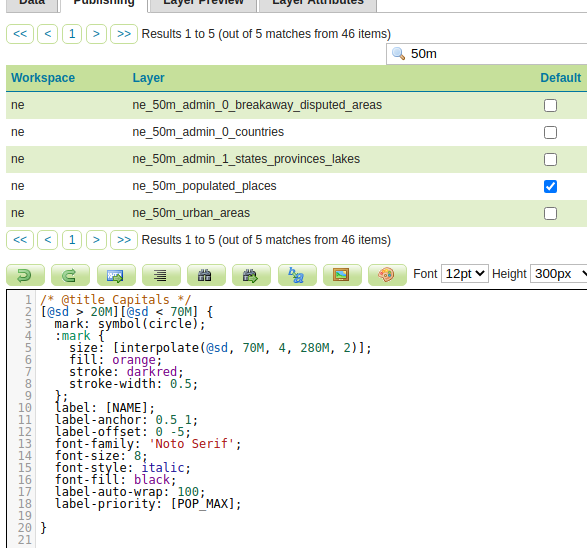
/* @title Populated places */
[@sd > 20M][@sd < 70M] {
    mark: symbol(circle);
    :mark {
        fill: red;
    };
    label: [NAME];
    label-anchor: 0.5 1;
    font-family: 'Noto Serif';
    font-fill: black;
    label-auto-wrap: 100;
    label-priority: [POP_MAX];
    label-padding: 2;

    [WORLDCITY = 1] {
        mark-label-obstacle: true;
        mark-size: 4;
        label-offset: 0 -5;
        font-size: 10;
    };
    [WORLDCITY = 0] {
        mark-size: 2;
        label-offset: 0 -2;
        font-size: 8;
    };
    [FEATURECLA like '%Admin-0 capital%'] {
        :mark {
        fill: orange;
        stroke: darkred;
        stroke-width: 0.5;
        };
        font-style: italic;
    };
}
Some notes about the style:
World cities are made visible by providing them a slightly bigger symbol, and making it a label obstacle, so that it cannot be hidden by other labels.
Capitals get a lighter fill color, a stroke around it, and italic font.
The layer group map should look as follows: