Creating a Base Map with a Layer Group
The best way to easily set-up a map with more than one layer for consumption is to create a Layer Group, that is what we are going to do in this section.
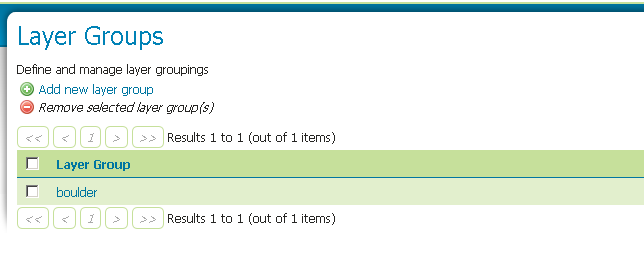
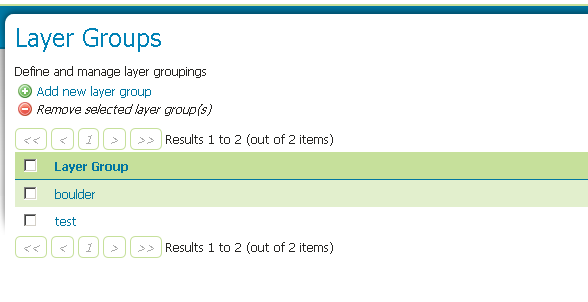
Locate the Layer Group link and click it.

Layer Group link
Click the Add new layer group link.
Add new layer group link
Name it
test.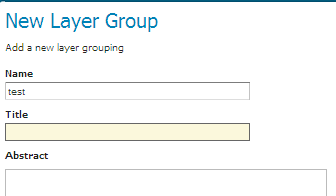
Click the Add layer link:
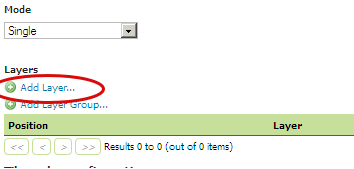
Add new layer
Select the “Mainrd” layer in the popup window.
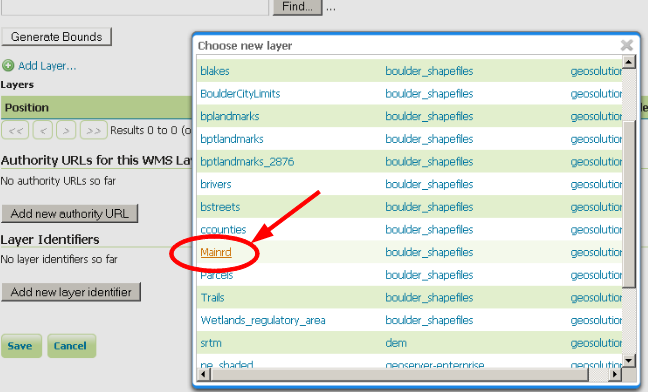
Select a layer
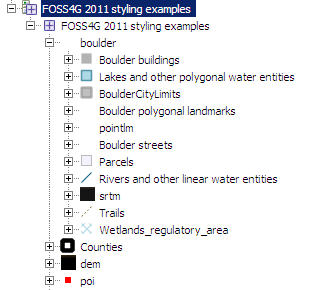
Add also “BoulderCityLimits” and “bplandmarks”, the final list should look like this:.
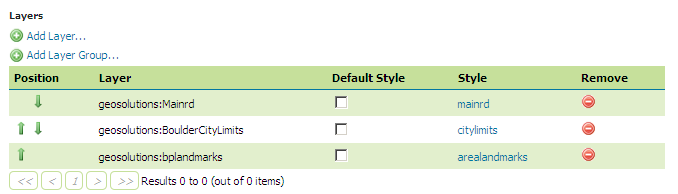
List of layers for the group
Note
You can use the green arrows to adjust the ordering of the layers until it looks like the above figure.
Click the generate bounds button to have GeoServer compute the group bounds from the layers inside of it.
Scroll to the bottom of the page and then click Save.
If all went well, you should see something like this:
After a successful save.
Note
The autogenerated bounds may be too large and you may experience a bad feeling when previewing the map. You can optionally reduce the layer group bounds by inserting manually the bbox values. Good values are the following: minx = 3.057.566,8646; maxx = 3.079.500,65246; miny = 1.241.929,35617; maxy = 1.257.467,5777
The layer group is now ready to be consumed:
Go to the Layer Preview link at the bottom of the lefthand menu.
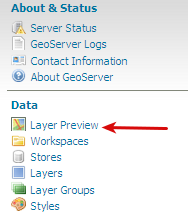
Layer Preview
Find the test layer group and click on the OpenLayers link to preview it.
OpenLayers view
Note
Check the browser’s address bar for an interesting sample WMS request for the layer.
As you might have noticed before, a larger, more realistic group has already been configured for you. It is named
boulder. Have a look at its definition and add to this the Mainrd layer. Then using the green arrows move the layer at the following position (see the screenshot).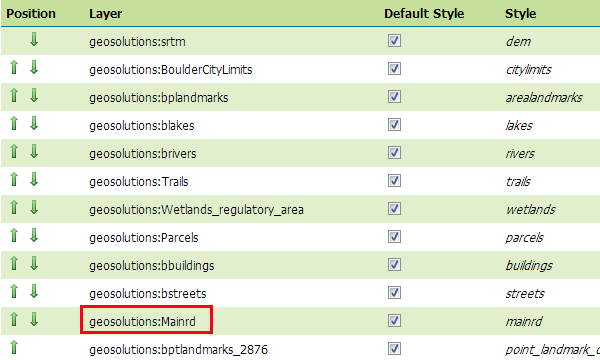
A new layer inside the existing layer group.
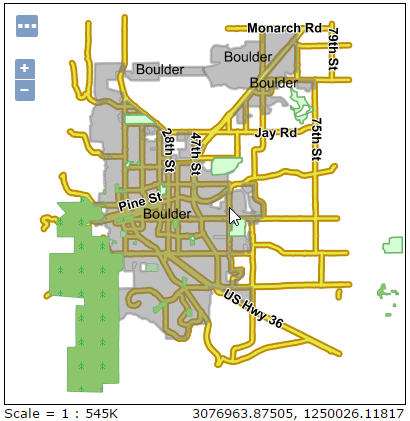
Then use the Map Preview to display it.
Try clicking in the middle of the map. A couple of tables with more information about the vector features that have been clicked should appear at the bottom.
Feature info
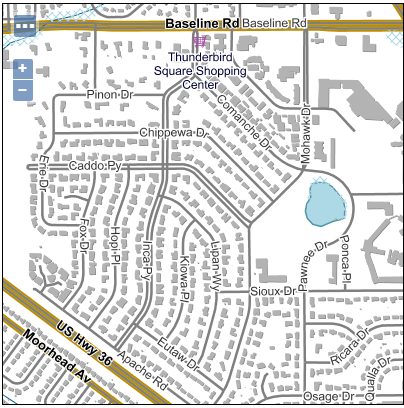
Try to zoom in more and more. New layers should start to appear. This is scale dependent styling.
Now let’s see how a desktop client (for our case, we use QGIS) handle the layer group and how we can change the way they see it.
Note
QGIS is an Open Source widely used GIS desktop client. Setup packages, for Linux or Windows, can be found from QGIS download.
Ensure that your Geoserver is up, and open a desktop client (our case, QGIS).
Once both GeoServer and QGIS are up, organize their windows so that you can see GeoServer and QGIS ones at the same time.
Now go to the GeoServer home page, where all the capabilities links are kept, right click on the WMS 1.3.0 one and select
Copy Link Addressfrom the context menu: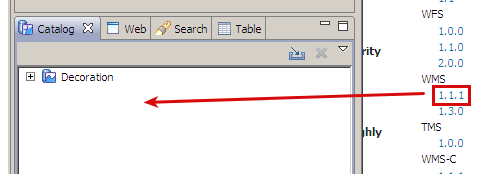
From the QGIS menu select
Layer>Add Layer>Add WMs/WMTS Layer..option.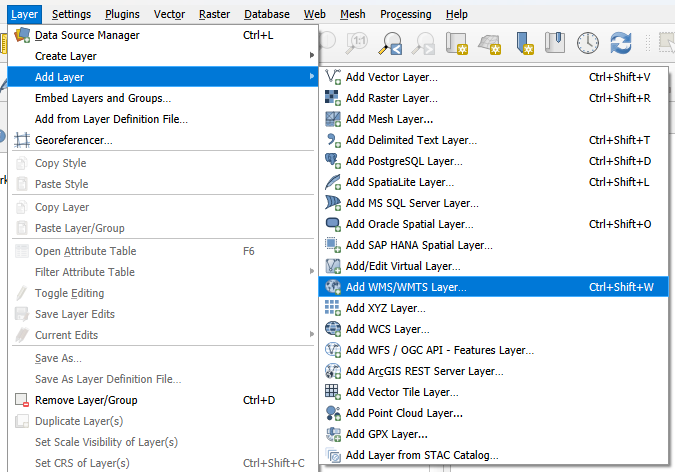
In the
Data Source Managerwindow press the New button and fill the Connection Details field. Insert the WMS capabilities link you copied from the GeoServer main interface as URL andGeoServer Trainingas Name. Press OK to save the new connection.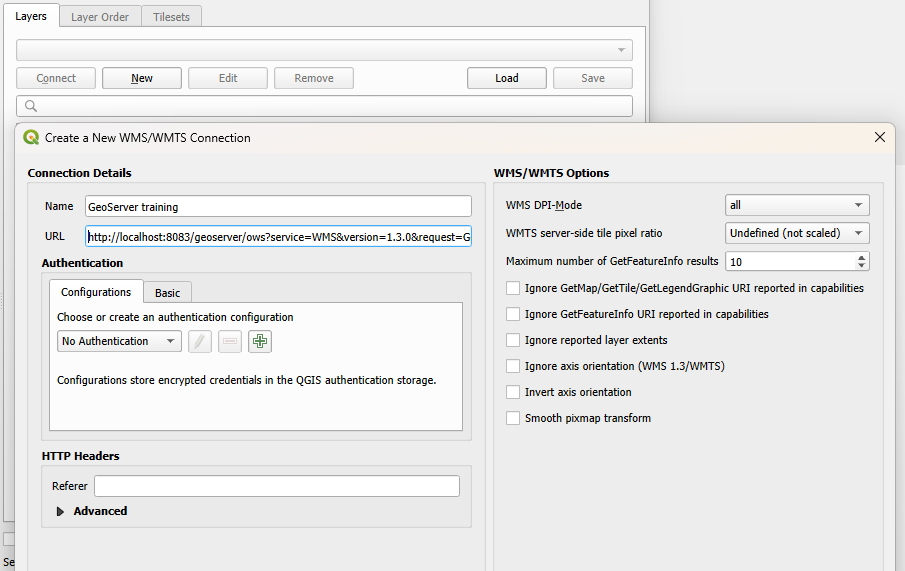
Press the Connect button, a list of available layers is retrieved and shown. Look at the layer tree. The
bouldergroup is visible as a simple layer and all the layers it contains are actually shown at the same level as the group.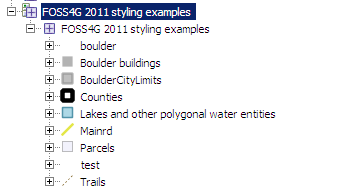
Let’s change it so that the layer group internal structure is shown. Go back to the
boulderlayer group page and change itsmodetoNamed tree, then press theSavebutton.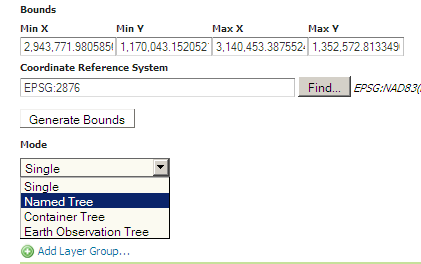
In our case, we need to make QGIS aware of the change. Go to the browser window, on the left side of QGIS interface, the right click the
GeoServer Trainingitem and selectRefreshoption from context menu.
Now most of the layers are contained inside the “boulder” group