Styling Vector Tile Layers in Maputnik
Navigate to the Maputnik editor, at either the https://maputnik.github.io/editor/ or http://localhost:8083/maputnik/.
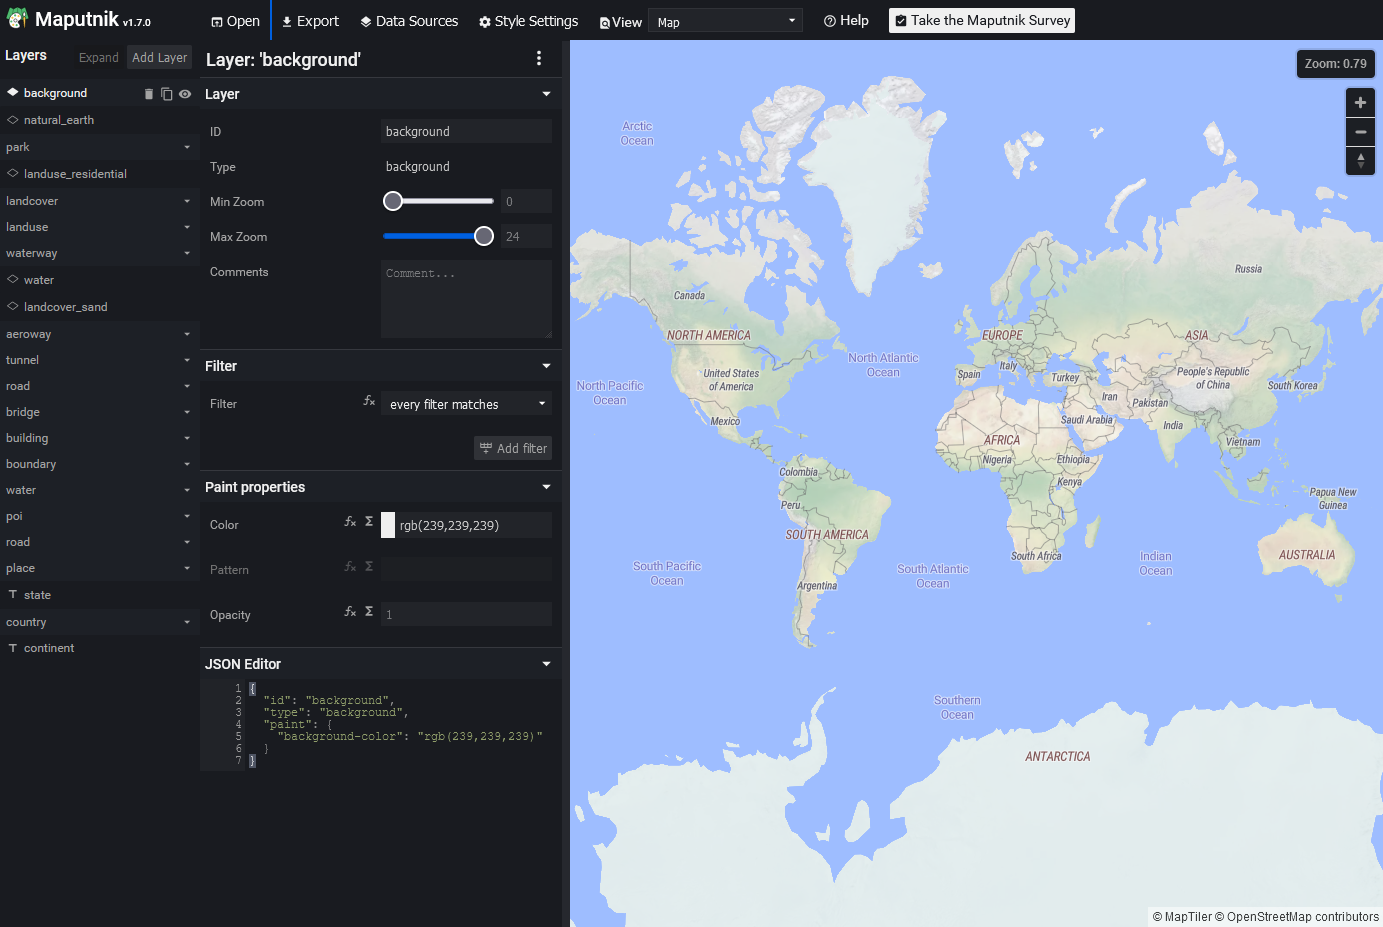
The Maputnik Editor
Open a new empty style, we will use our style in GeoServer which will not use other tile sources the Maputnik style editor offers. Background layers are also not supported in GeoServer so there will be no need to add one.
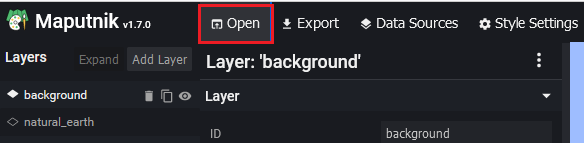
Click on Open
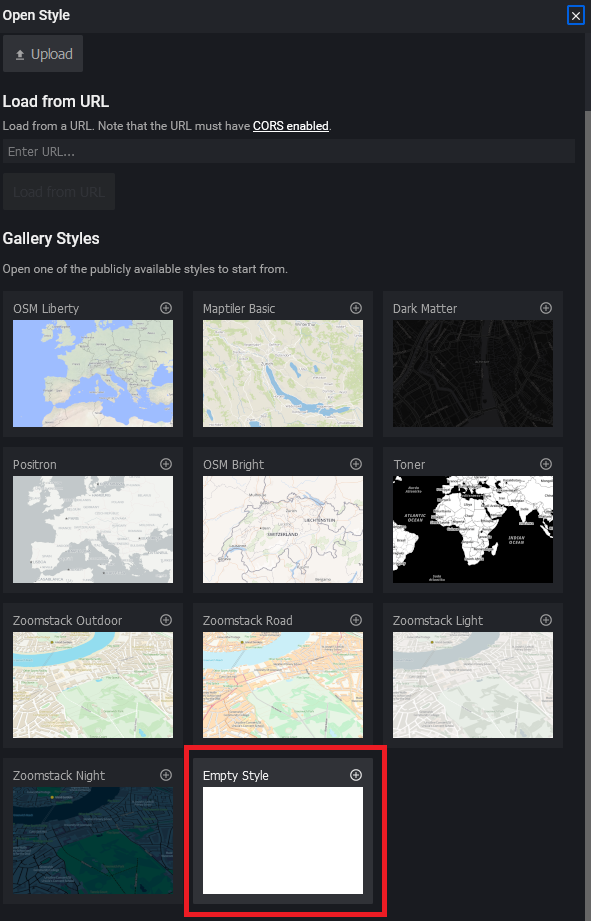
Select the Empty Style
We will now add a new source for the states layers
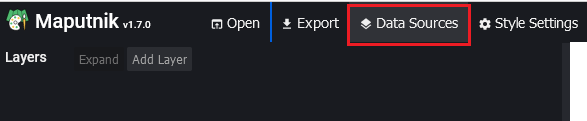
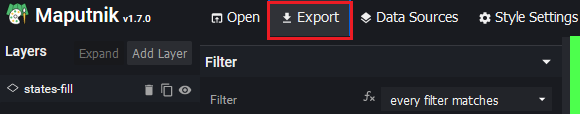
Click on Data Sources
Select the Vector (XYZ URLs) option from Source Type dropdown list.
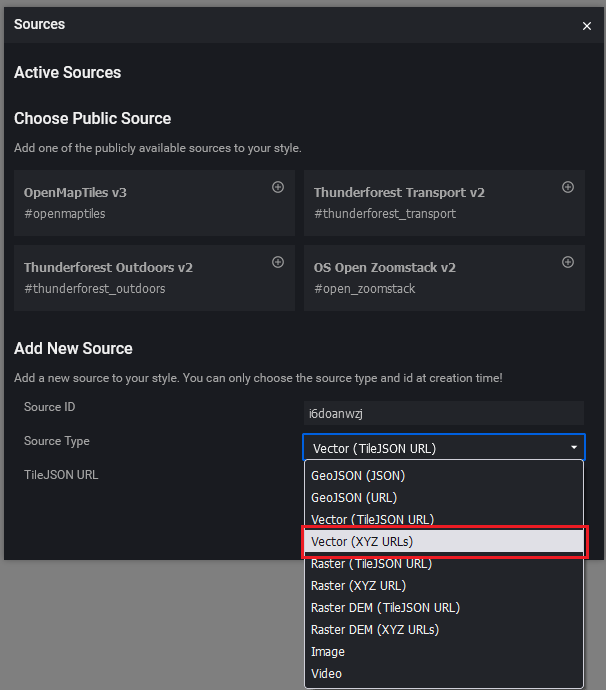
We now need to enter the source URL of the layer or layer group we want to use.
Our source string is
http://localhost:8083/geoserver/gwc/service/wmts/rest/topp:states/topp:states-mvt/EPSG:900913/EPSG:900913:{z}/{y}/{x}?format=application/vnd.mapbox-vector-tileNote
The source string is built in the following way
The
Server AddressThe server we are asking for tiles, in this case from a local GeoServerhttps://localhost:8083/geoserver/The
Service Typewe are asking GeoServer to provide, in this case we want a WMTS layer through GeoWebCachegwc/service/wmts/rest/The
Layer or Layer Groupvector tiles can contain multiple layers, if we supply a WMTS with a single layer that will be used, but if we add a WMTS source created from a layer group we can style each of the layers in the group. The layer is specified as{workspace}:{layer}topp:statesThe
StyleWe can leave this blank to get the default style for the layer, but in this case we want to use a specific styletopp:states-mvtThe
TileMatrixSetWhat coordinate system are we querying tiles in? by default Mapunik as well as most web mapping libraries use web mercator/google mercator which are represented by EPSG code 900913 in GeoServer.EPSG:900913The
TileMatrixWhat is our zoom level in the TileMatrixSetEPSG:900913:{z}The
TileRowWhat is our tile’s Y location{y}The
TileColWhat is our tile’s Y location{x}The
Output Formatwhat is the format we want tiles in? If we were using raster tiles this can be an image format, or even if we use WFS GeoJSON but in this case we want MapBox vector tile?format=application/vnd.mapbox-vector-tile
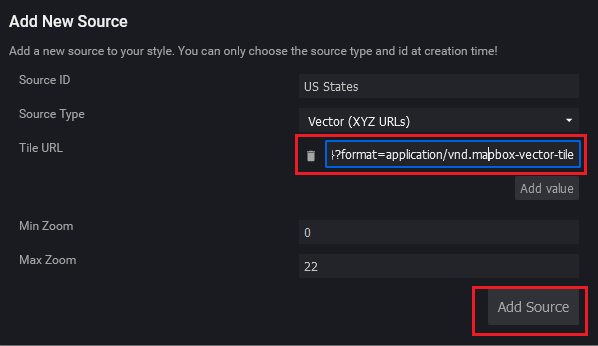
Add the URL string and click on Add Source
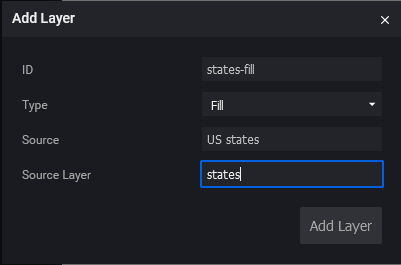
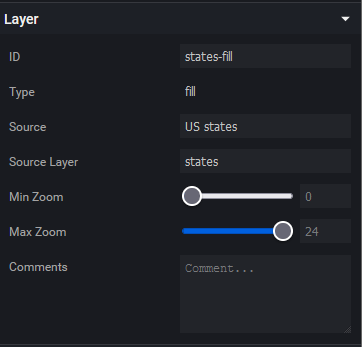
Add the layer to the map, click the Add Layer button from the top left panel, and enter the details of the layer. The ID needs to be unique, and the sources list drops down and allows you to select the source you added. The layer name needs to be copied from GeoServer however, it does not need the workspace name.
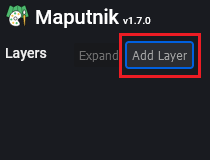
Open the Add Layer menu
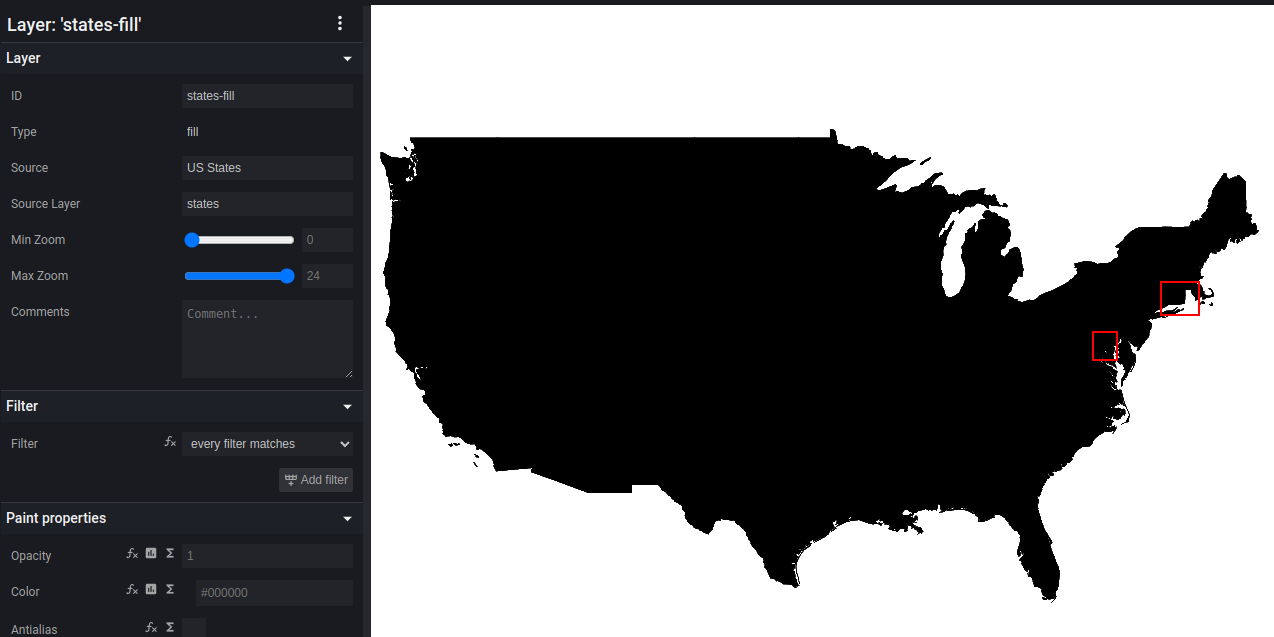
All layers are initialy added with all colors set to black.
We can now style the layer, we will review some of the styling options, mostly those recgnized by GeoServer and learn how to filter the layer, how to select a color by attribute and how to set the visibility of features by zoom level (MBStyle uses zoom level instead of map scale as it is designed for interactive web maps). You will see that while Maputnik allows us to style layers using a graphical interface, in some cases we will have to edit the styling rules according to the MapBox style specification or according to what GeoServer will accept.
Simple Style
We will start with a simple style, simply selecting the fill color, stroke color and opactiy of all the features in the layer.
To set the fill and stroke colors of our layer, as well as its opacity we first scroll down to the Paint Properties section of the style panel.
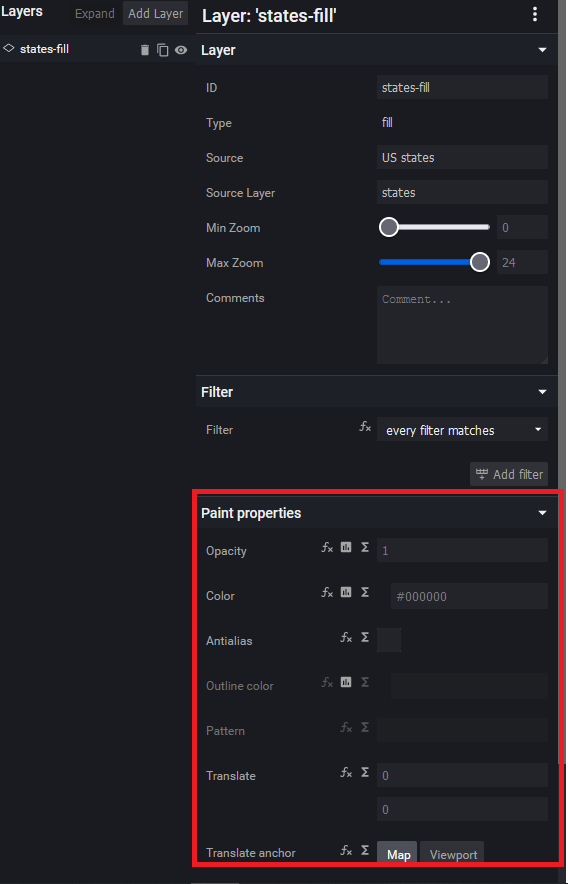
Set the fill color of the layer to red, either by filling out the text input with
#FF0000or by clicking it and manually selecting the color using the color picker.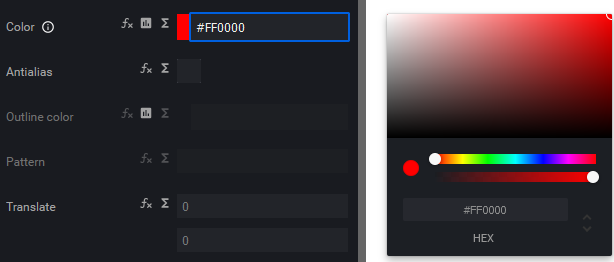
Next set the Outline color to white and the opacity to
0.5. Your layer should now look like this.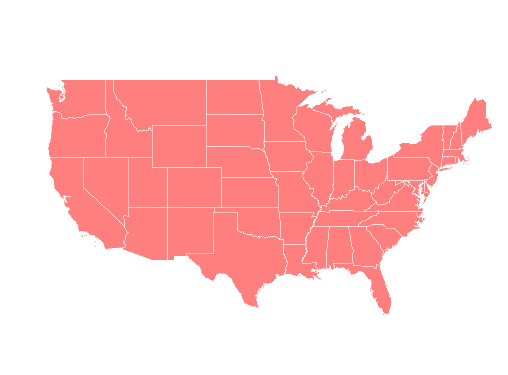
Filter By Attributes
There are two ways to filter a features by attributes using MBStyle
Create a filter for the entire layer, creating a new layer for each filter rule (similar to the way each SLD rule needs a new symbolyzer)
Use an expression to determine the value of a property.
Creating A Filter For The Entire Layer
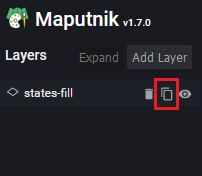
Duplicate the layer using the duplicate button and Change its opacity to 1.
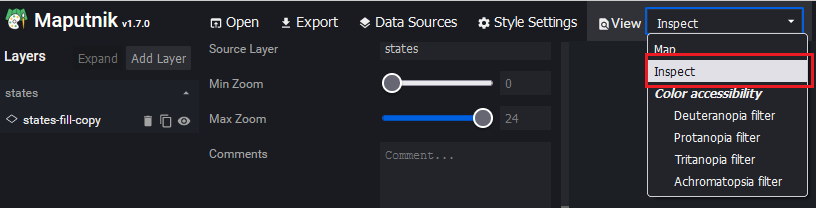
To find the values of the the attribute you want to use for your filter, switch between Map and Inspect mode in the top bar.
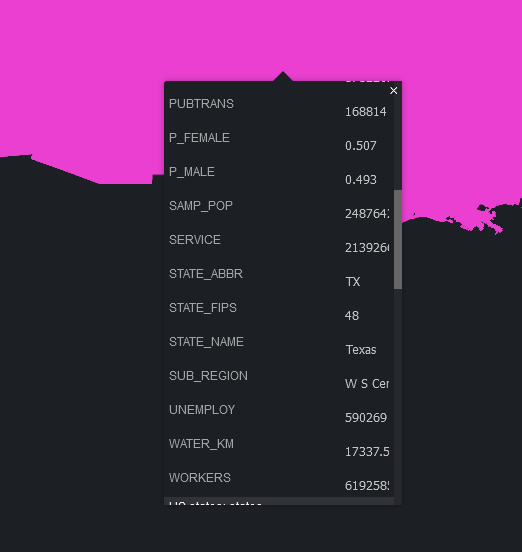
Click the state you want to select using the filter rule
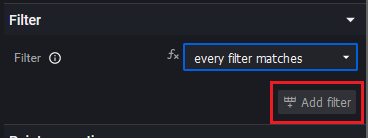
In Map mode, go the Filter section of the style panel, and click the Add Filter button.
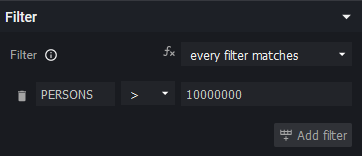
In the leftmost text input replace name with PERSONS, set the medium input to > (Greater than) and the in the right text input write 10000000. This will leave only the states who have a population larger than 10,000,000.
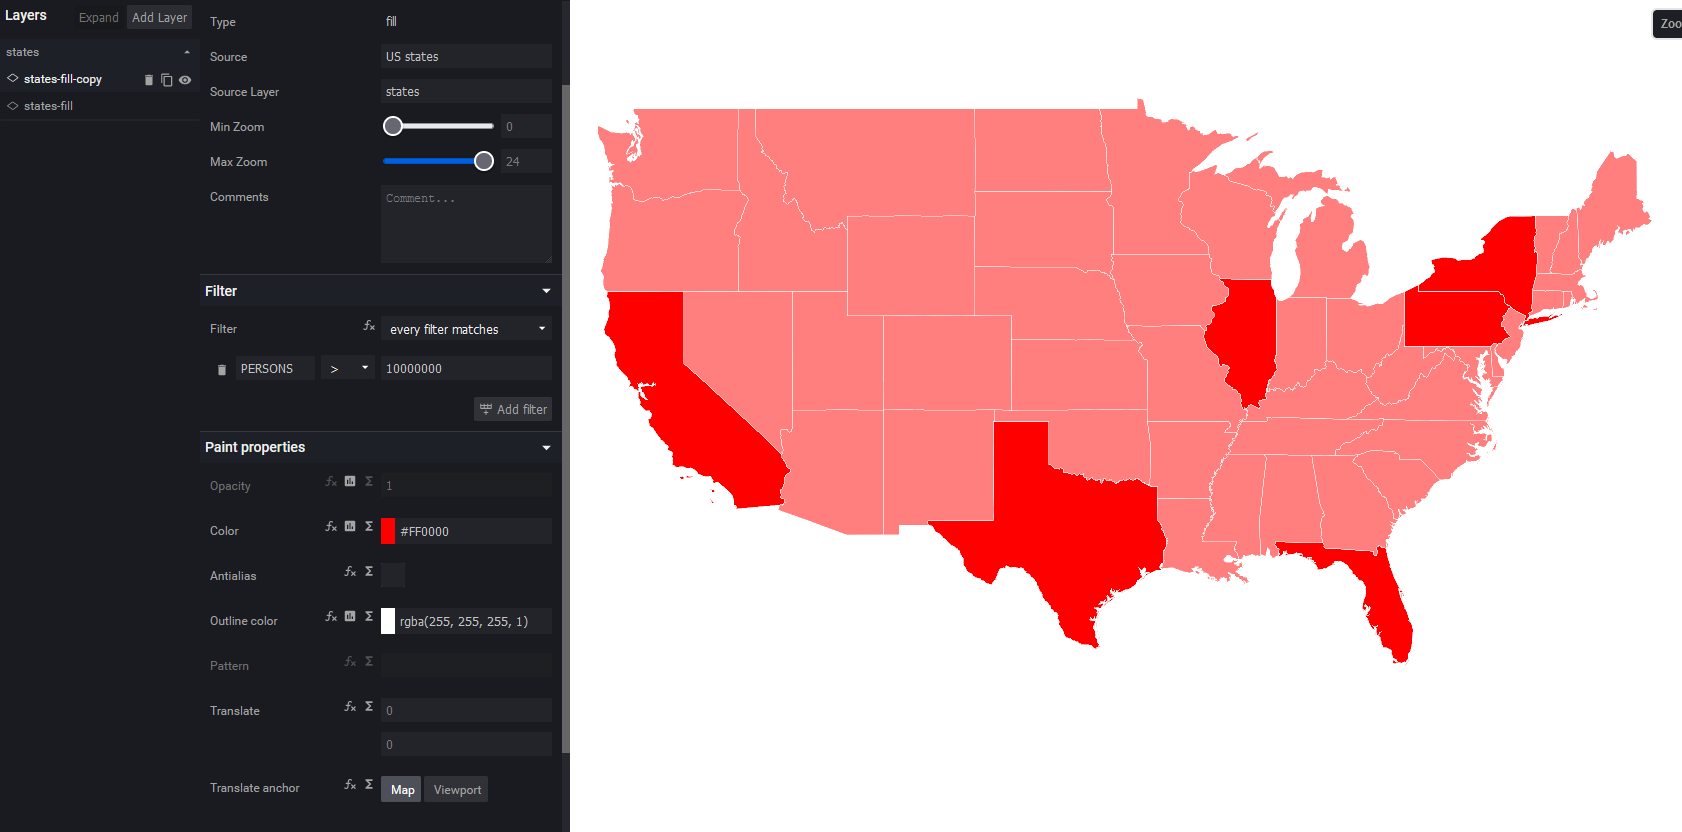
The filtered layer (without opacity) over the not filtered layer
You can decide wether to use multiple filters and wether you want every, any or none of the filter rules to control the filtered features.
Filter Using An Expression
Change the opacity of the layer to 1.
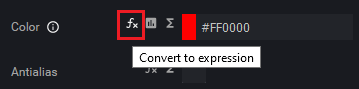
Click the Convert to expression button next to the Color selection input.
In the text input box enter the following expression:
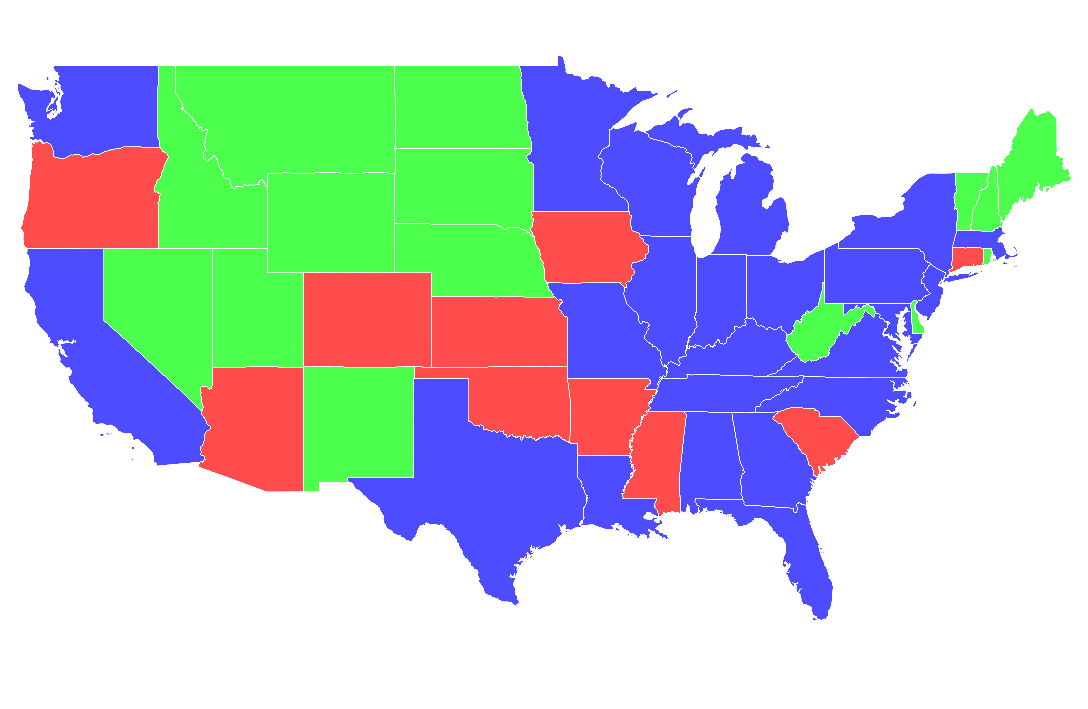
["case",
   ["<", ["get", "PERSONS"], 2000000],"#4DFF4D",
   ["all",
      [">=",["get", "PERSONS"],2000000],
      ["<", ["get", "PERSONS"], 4000000]
   ],"#FF4D4D",
   [">=", ["get", "PERSONS"], 4000000],"#4D4DFF",
   "#000000"
]
This expression will create three breaks for the data based on the PERSONS attribute. You can learn more about MapBox Style expression at the MapBox Style specification page.
Your map should now see every state with a population of less than 2 Million in green, those with more than 4 Million in blue and every state in between in red.
Limit Visibility By Zoom
Limiting visibility by zoom can be done relatively easily, simply toggle the Min Zoom and Max Zoom sliders.
Zoom levels have a different scale which differs by latitude, at the equator zoom level 0 shows the map at a scale of about 1:500,000,000 and zoom level 20 at a scale of about 1:500. For further reading about web map zoom levels see the OpenStreetMap Zoom Levels page. You can change paint properties based on zoom levels using the “zoom” variable. In the next example we’ll use a zoom function to change the outline color.
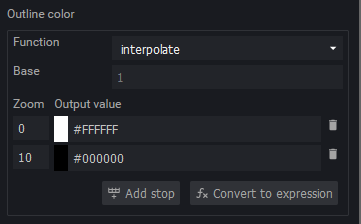
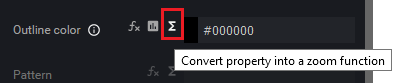
Click the Convert property into a zoom function button next to the Outline color selection input.
In the new menu change the first zoom input to 0 and the color to white, this will change the Outline color based on the zoom when you scroll, between levels 0 and 10 the color will be different shades of gray.