The following section explains how GeoServer performances are improved when using optimized styles since styling is an important feature but requires some attention in order to avoid slowing down the performances.
This tutorial aims at showing how GeoServer performances change by choosing a different style for the same data set using JMeter.
One of the key tricks with styling data is to delay the display of detailed layers at higher zoom levels by filtering data based on attributes to display only the important features first.
If you show too much data the map will not be readable, but rather a graphic blob. Rule of thumb: never show more than 1000 features (records) max in the display. A few additional hints:
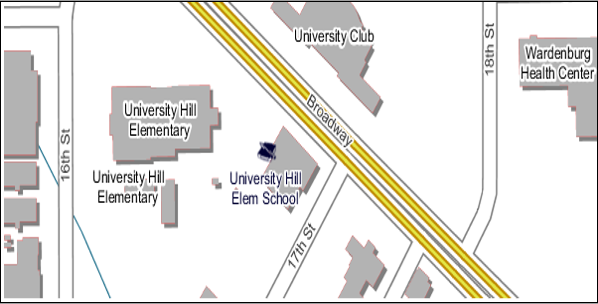
Have labels show up only when zoomed in
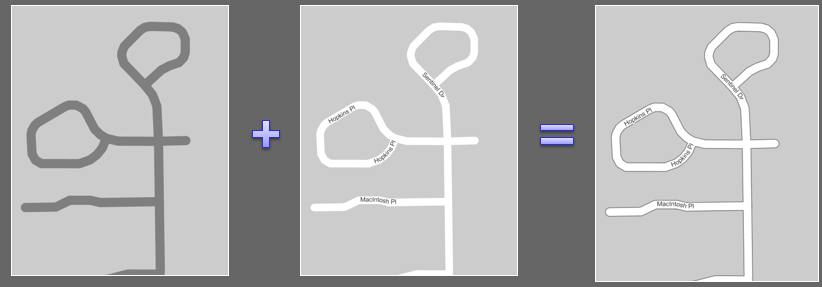
Show details as you zoom in
Eagerly add MinScaleDenominator to your SLD rules
Add more expensive rendering when there are less features, this is key to get both a good looking and fast map
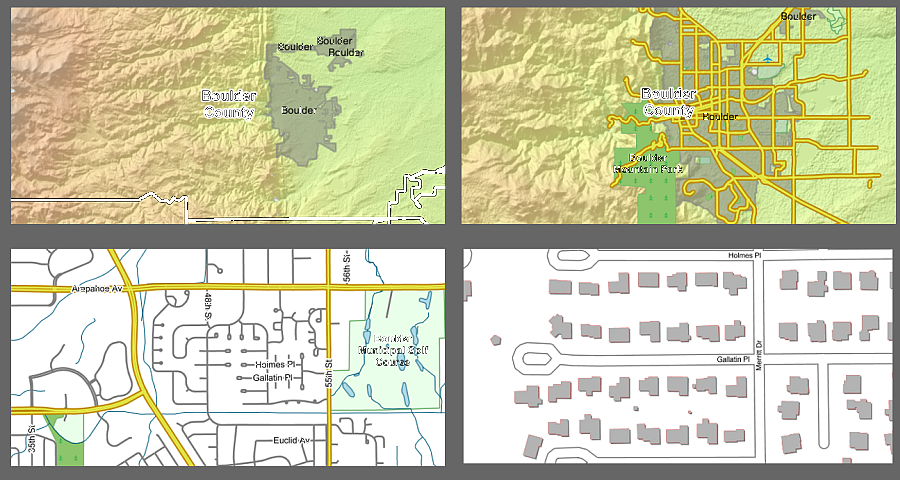
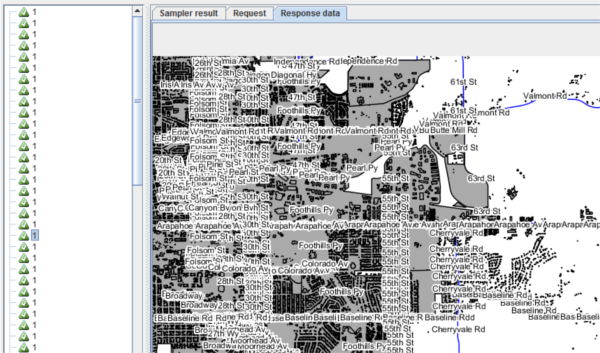
In the picture below we can see various applications of scale dependencies. Detailed layers, such as streets and buildings, show up only when fairly zoomed in. The DEM is hidden when we get very close to the city to avoid getting the representation too «busy», visually speaking. The streets change from simple line to cased line.
GeoServer uses SLD FeatureTypeStyle objects as Z layers for painting. Each one allocates its own rendering surface (which can use a lot of memory), hence the recommendation here is to use as few of them as possible.
On your Web browser, navigate to the GeoServer Welcome Page.
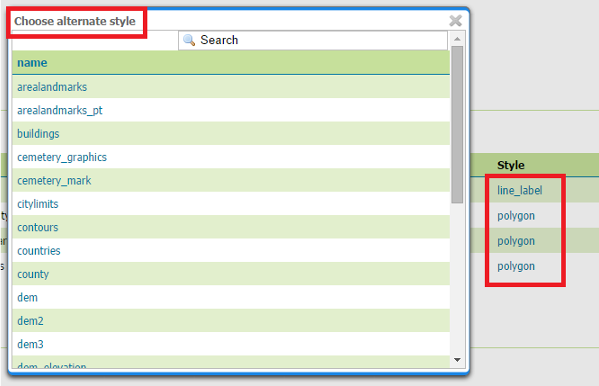
Go to Styles and click on AddnewStyle
On the bottom of the page, click on Choose File and select the SLD file called line_label in the $TRAINING_ROOT/data/jmeter_data ( %TRAINING_ROOT%\data\jmeter_data if you are on Windows ) directory
Click on Upload and then on Submit. Now we have a style which supports labeling but has no control on the label conflicts and overlapping
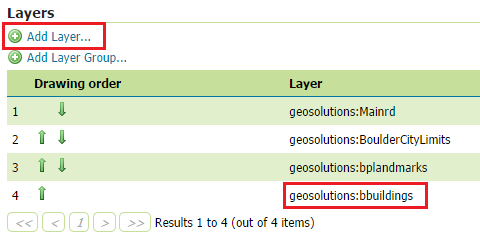
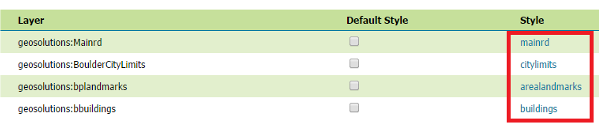
Click on Save. With this configuration we have a Layer Group composed by 4 Layers with 4 bad styles associated. This will result in a low throughput, if compared to that of the test with optimized styels.
Go to $TRAINING_ROOT/data/jmeter_data ( %TRAINING_ROOT%\data\jmeter_data on Windows ) and copy the file template.jmx file and create a styles.jmx one
From the training root, on the command line, run jmeter.bat ( or jmeter.sh if you’re on Linux) to start JMeter
On the top left go to File –> Open and search for the new jmx file copied
Disable Thread Group8, 16, 32 and 64
In the active CSVDataSetConfig elements, modify the path of the CSV file by setting the path for the file style.csv in the $TRAINING_ROOT/data/jmeter_data ( or %TRAINING_ROOT%\data\jmeter_data on Windows ) directory
In the HTTP Request Default element modify the following parameters:
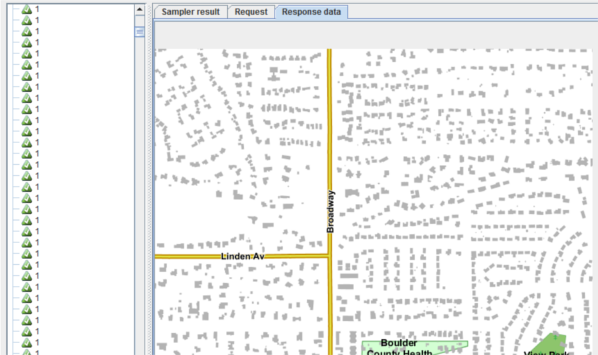
You may see that the throughput is greater than that of the first test. The use of scale dependencies reduces the layers to see at lower zoom levels while conflict resolution avoids to show multiple overlapping label at each zoom level.